

User manual · version 1.0.2
Slope Calculator
Slope, gradient and the level at every chainage, with crossfall, a digital level run, an optical level trainer and professional reports. For surveyors and site engineers, in the browser and on Windows. By Excel to KML.
1. Getting started
Slope Calculator is the same app in two forms: the web app at exceltokml.com/slope-calculation/app, which runs in Chrome, Edge, Firefox or Safari on a computer or a phone, and the Windows program for Windows 10 and 11.
- Web app: open the address. To use it like an app, choose Install (Chrome, Edge) or Add to Home Screen (Safari).
- Windows: download
SlopeCalculator-Setup.exefrom the product page and open it. It installs for you alone, needs no administrator rights, and adds Start menu and desktop shortcuts. If Windows SmartScreen says it protected your PC, choose More info, then Run anyway. Uninstall it from Settings → Apps. - Updates: the Windows program looks for a new version a few seconds after it opens and offers to install it. The web app is always the newest.
Signing in
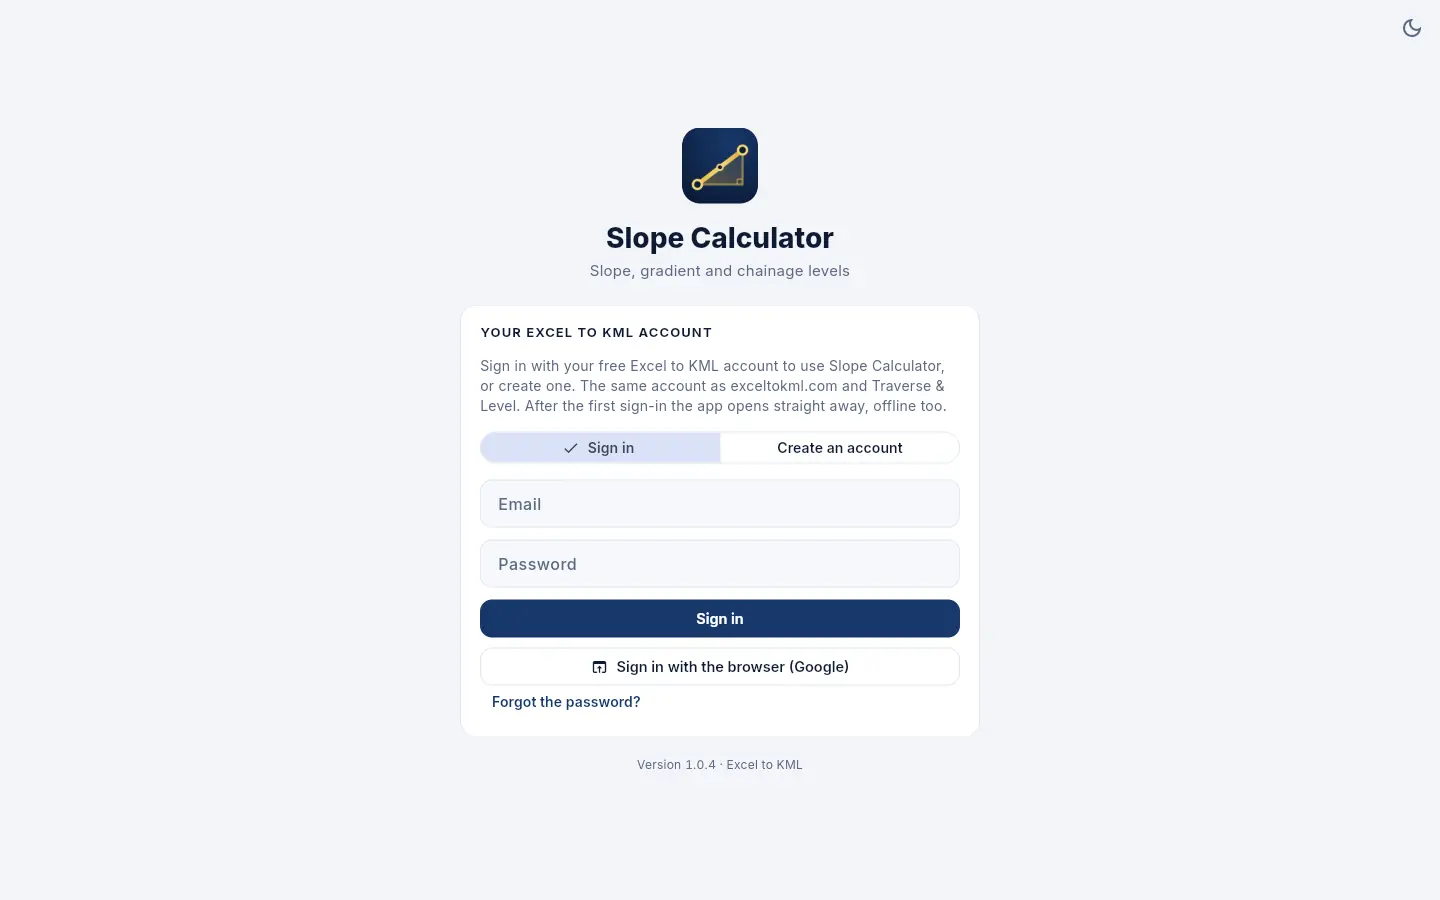
The app opens on the sign-in. Use your free Excel to KML account, the same one as exceltokml.com and Traverse & Level, or create one:
- Sign in with your email and password.
- Create an account with your name, email and a password of at least 8 characters. We email a 6-digit code; type it in to confirm the email.
- Sign in with the browser (Google): your browser opens at exceltokml.com with a code. Sign in there (Google works) and confirm the code; the app signs in by itself.
- Forgot the password? Type your email first, then press it: a link to set a new one is emailed.
After the first sign-in the app remembers you on that device and opens straight away, offline too, until you sign out. In the browser, if you are already signed in on exceltokml.com, the web app opens directly.
The first sign-in needs an internet connection. After that the app works offline; signing out on a device means signing in again, online, before using it there.
2. The calculator
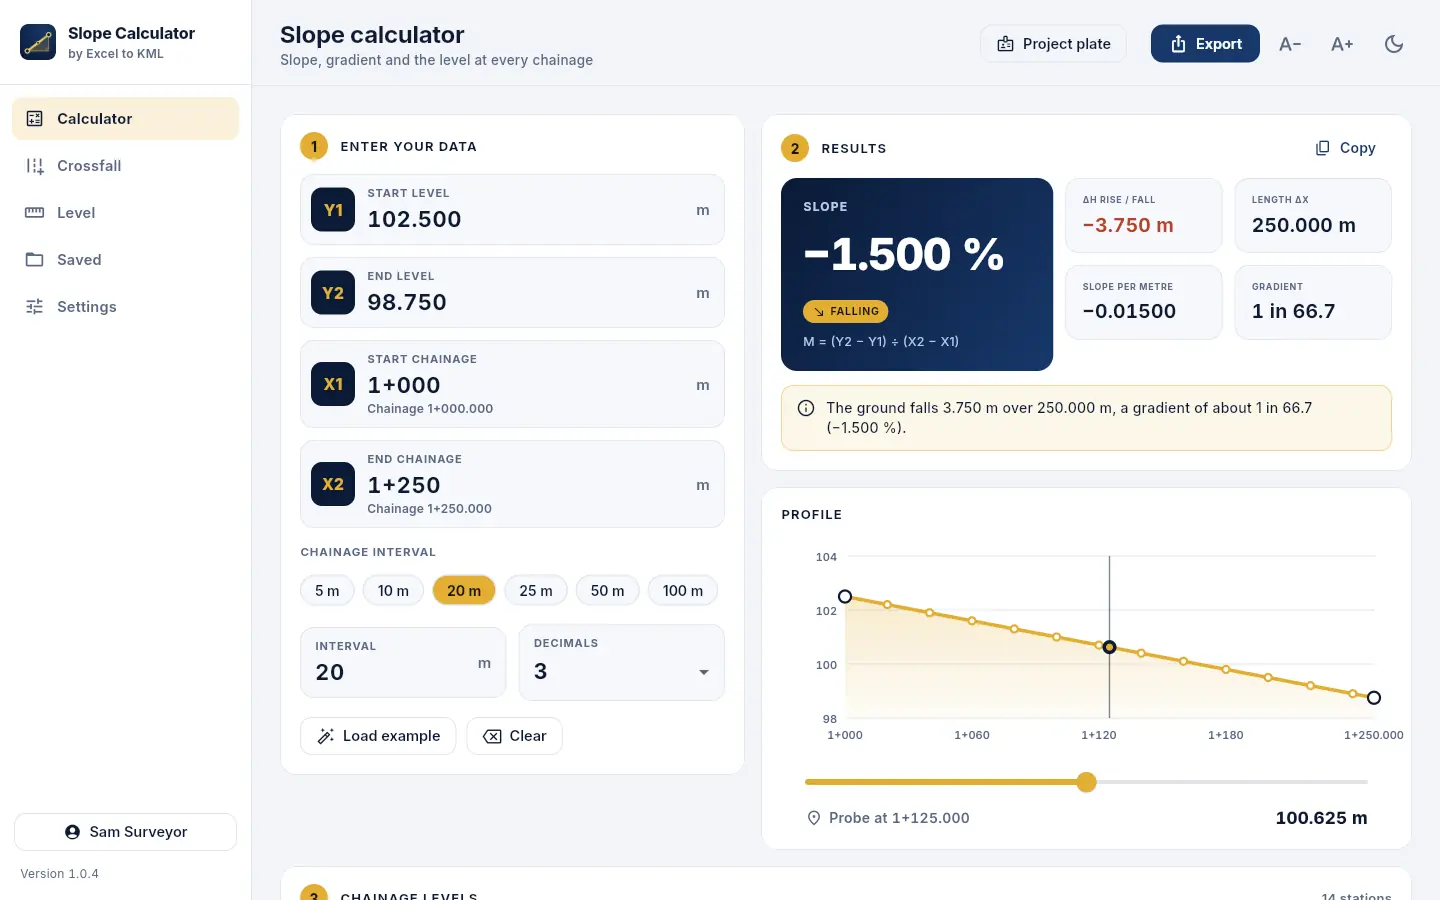
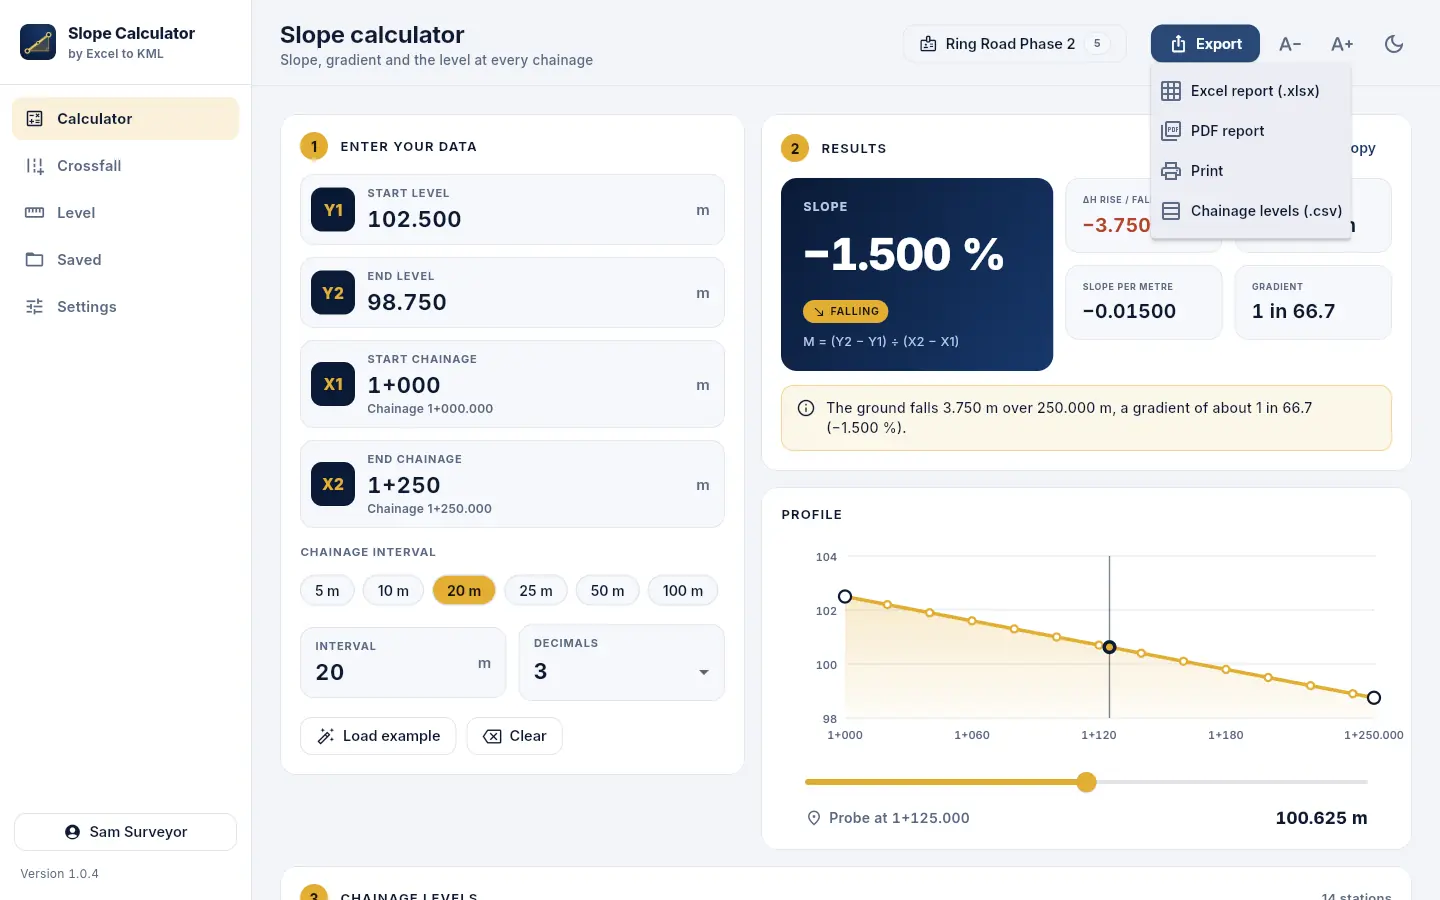
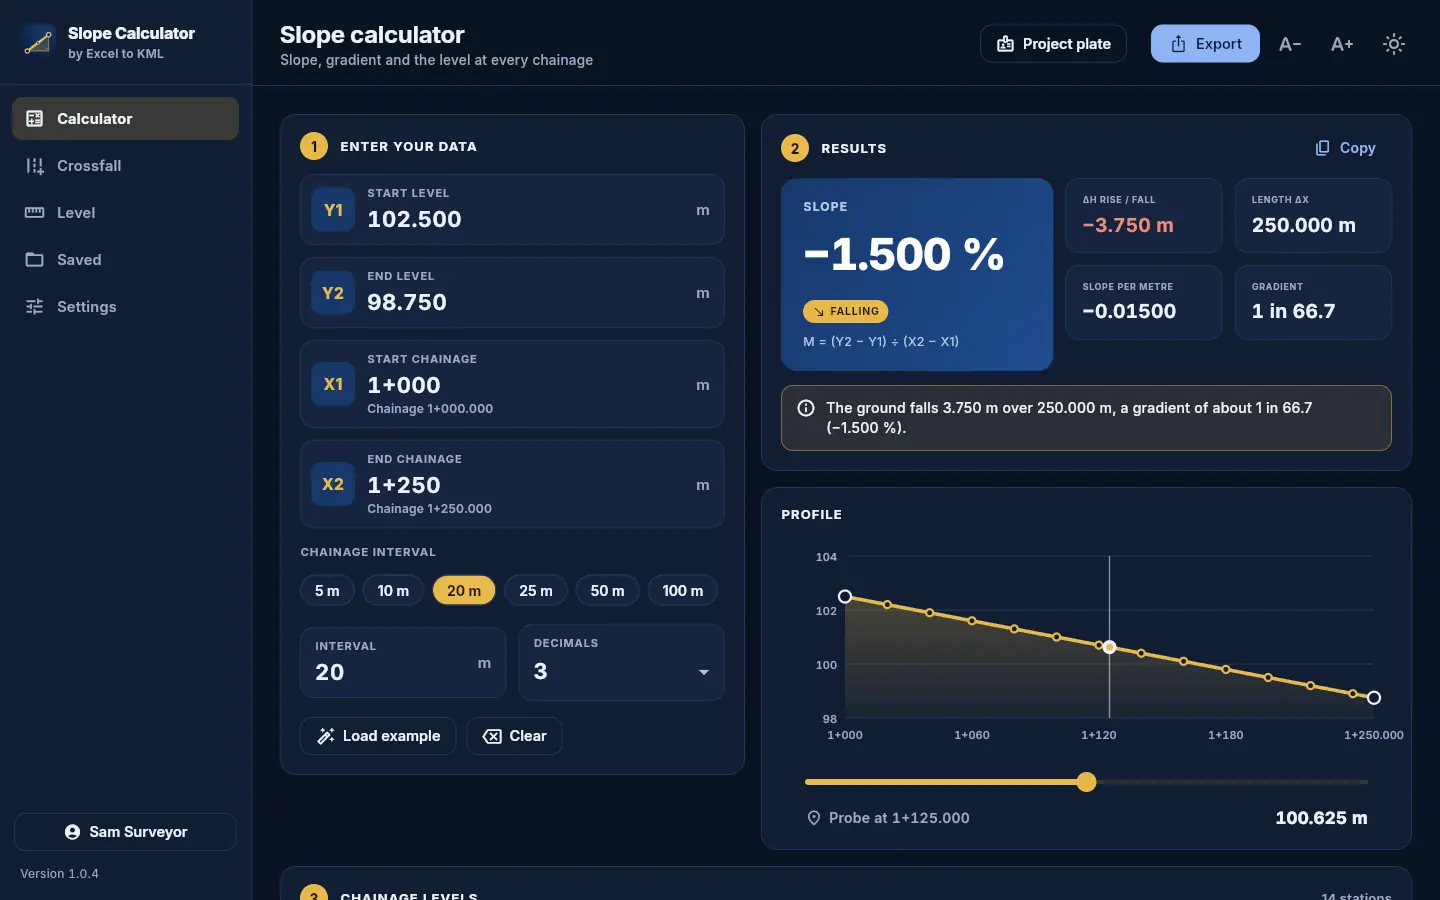
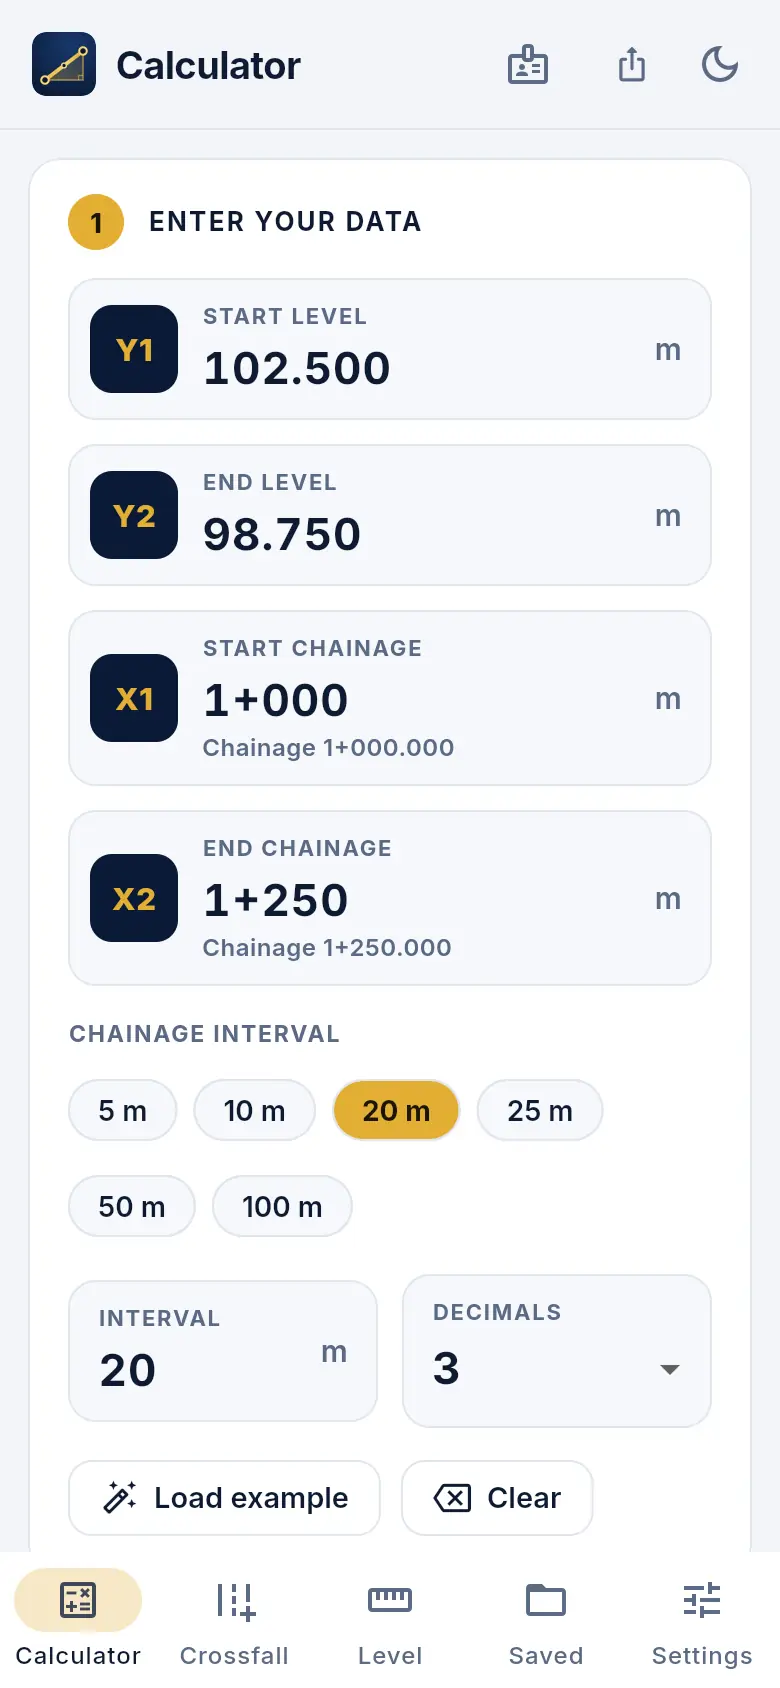
The calculator is the first page. Type four values in Enter your data; the results follow as you type.
| Box | What to type |
|---|---|
| Y1 Start level | Level at the start, in metres (102.500) |
| Y2 End level | Level at the end, in metres (98.750) |
| X1 Start chainage | 1000, 1000.5, 1+000 or 1+000.500; negative chainages work too |
| X2 End chainage | The same formats; it must be further along than X1 |
| Chainage interval | Pick 5, 10, 20, 25, 50 or 100 m, or type any interval |
| Decimals | 1 to 5 places for levels in the tables and reports |
Press Enter to move to the next box. Load example fills in the Excel template's example; Clear empties the boxes. The app remembers what you typed.
Results
| Result | How it is worked out |
|---|---|
| ΔH rise / fall | Y2 − Y1 |
| Length ΔX | X2 − X1 |
| Slope per metre M | ΔH ÷ ΔX |
| Slope % | M × 100 |
| Gradient | 1 in 1 ÷ |M| |
| Direction | Rising, falling or level, from Y1 to Y2 |
A sentence under the results says it in words, for example The ground falls 3.750 m over 250.000 m, a gradient of about 1 in 66.7 (−1.500 %). Copy puts the results on the clipboard. If something can't be worked out (an empty box, X2 not further than X1, an interval of 0, or so many stations that a larger interval is needed) the app says what to fix instead of showing results.
3. Chainage levels and the profile
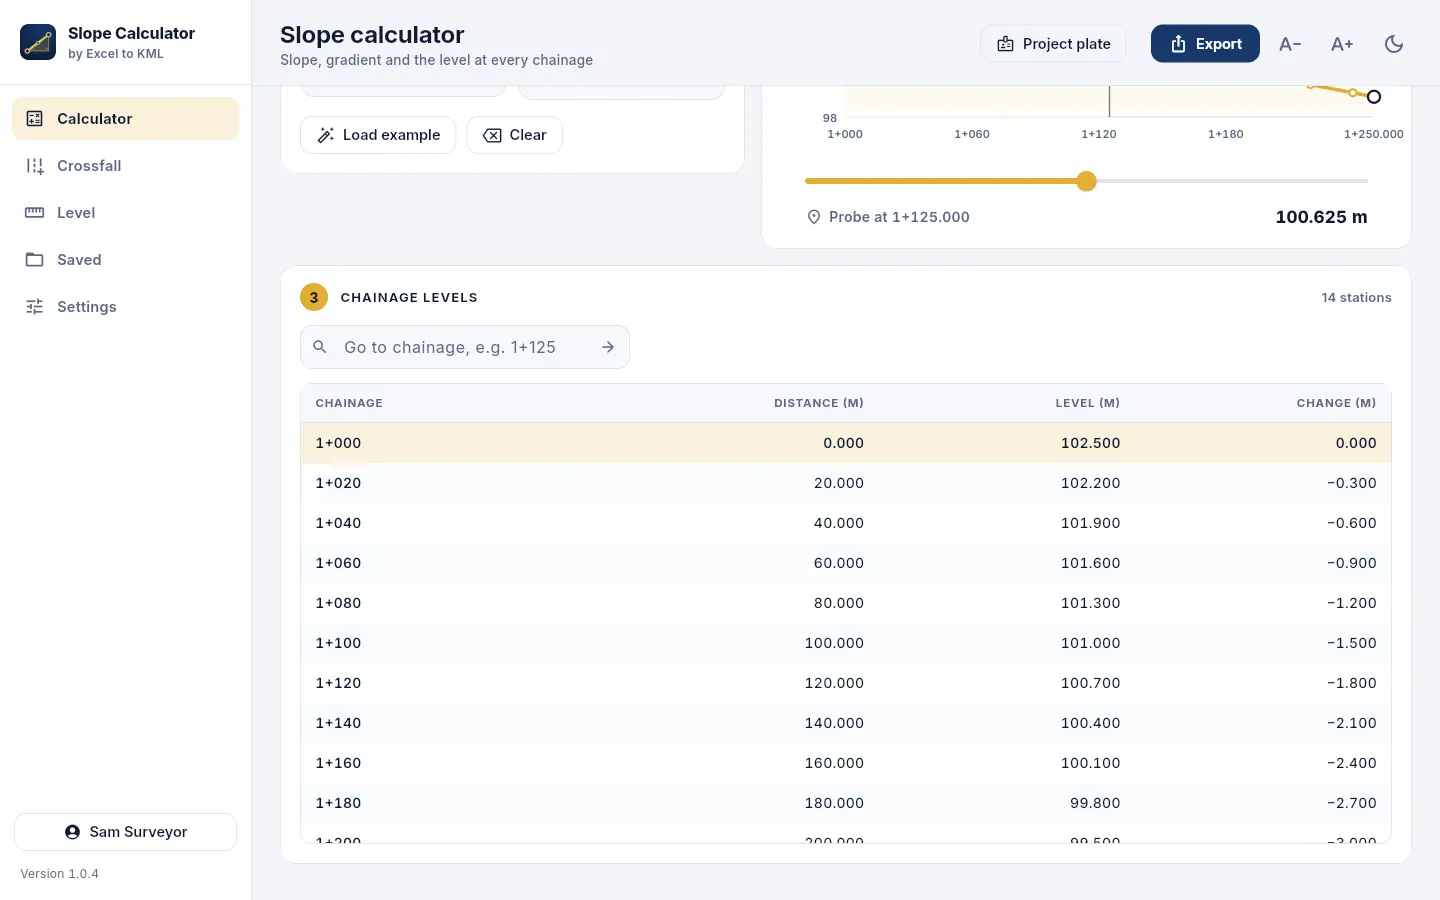
The profile draws the line from Y1 to Y2 with every station. Drag the probe under it to read the level at any chainage between the ends. The Chainage levels table lists every station with its distance from the start, its level and the change from the start; type a chainage in Go to chainage to find it.
Stations come on round chainages (from 1+013 every 20 m: 1+013, 1+020, 1+040 …) or counted from the start (1+013, 1+033, 1+053 …); choose in Settings. The start and the end are always stations.
4. The project plate
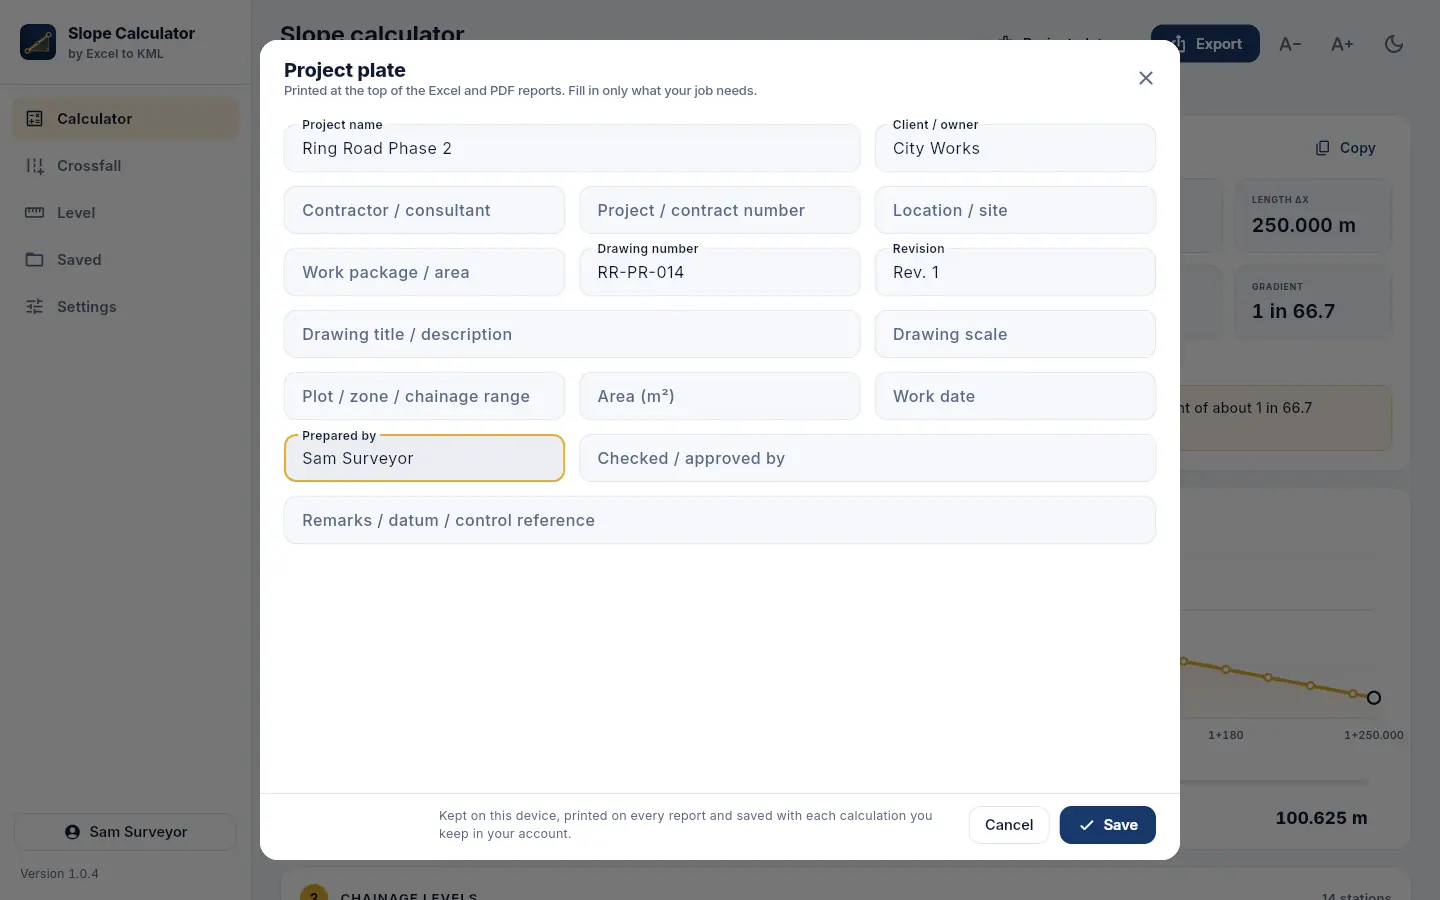
Project plate (at the top of the calculator) holds the details printed at the top of every report: project, client, contractor, contract number, location, work package, drawing number, revision, drawing title, scale, zone, area, work date, prepared by, checked by and remarks. Fill in only what your job needs and press Save. The button then shows the project's name and how many details are filled in.
5. Reports: Excel, PDF, CSV and print
Press Export at the top of the calculator:
- Excel report (.xlsx) with six sheets: Project Plate, Slope Summary, Chainage Levels, Crossfall, Level Book (after a digital level run) and a QA / QC checklist. Numbers are stored as numbers, so you can work with them in Excel.
- PDF report: A4 with the project plate, the results, the profile, the chainage levels and sign-off boxes.
- Print: the same report, to a printer.
- Chainage levels (.csv); the level book has its own CSV button on the Level page.
On Windows you choose where to save; in the browser the file is downloaded. File names start with the project name when the plate has one, and end with the date.
6. Crossfall
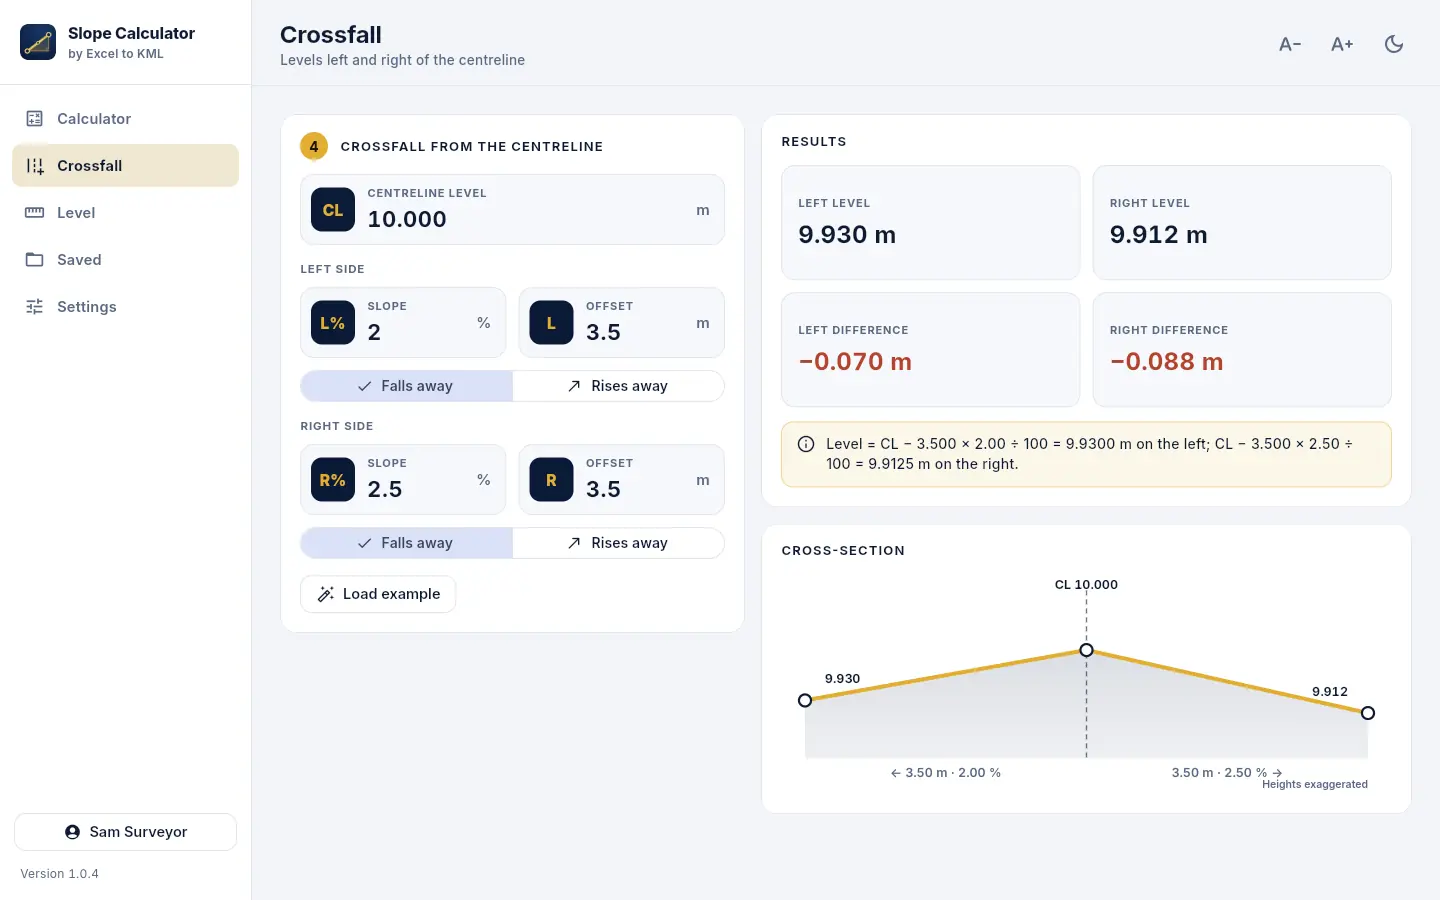
Enter the centreline level, and for each side the crossfall %, the offset from the centreline and whether it falls away or rises away. The left and right levels and their differences from the centreline follow, with the cross-section drawn. Level = CL ± offset × crossfall % ÷ 100.
7. Digital level run
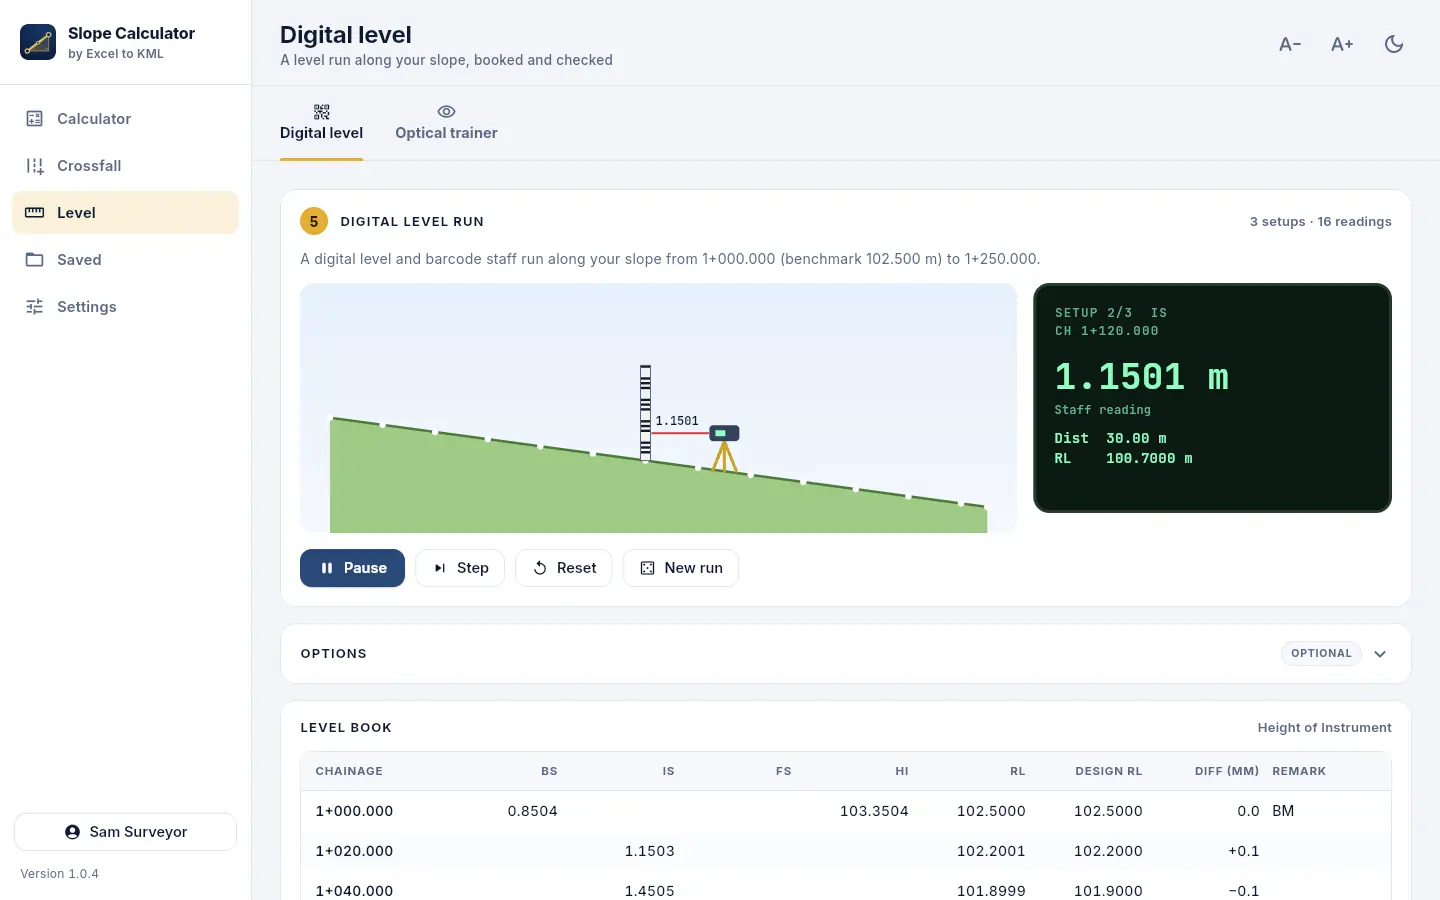
Level → Digital level shows a level run along your slope with a digital level and a barcode staff, from the start (the benchmark, Y1) to the end. Press Start the run to watch it, Step for one reading at a time, Reset to start again or New run for new readings. The instrument's display shows each reading, its distance and the reduced level, and each reading is booked in the level book as it is taken.
- Setups keep every sight within the max sight, and readings stay on a 4 m staff: on a steep slope extra change points are added.
- Options: max sight, reading noise (mm), collimation error (mm per 100 m), speed, and booking by Height of Instrument or Rise & Fall.
- Checks: the arithmetic check (ΣBS − ΣFS = last RL − first RL, and ΣRise − ΣFall for Rise & Fall), the closing error against the end level, and the allowable misclosure C√K mm (K the length in km, C in Settings). The closing error is spread over the setups for the adjusted levels.
- Export the level book as CSV here; the Excel report includes it.
8. Optical level trainer
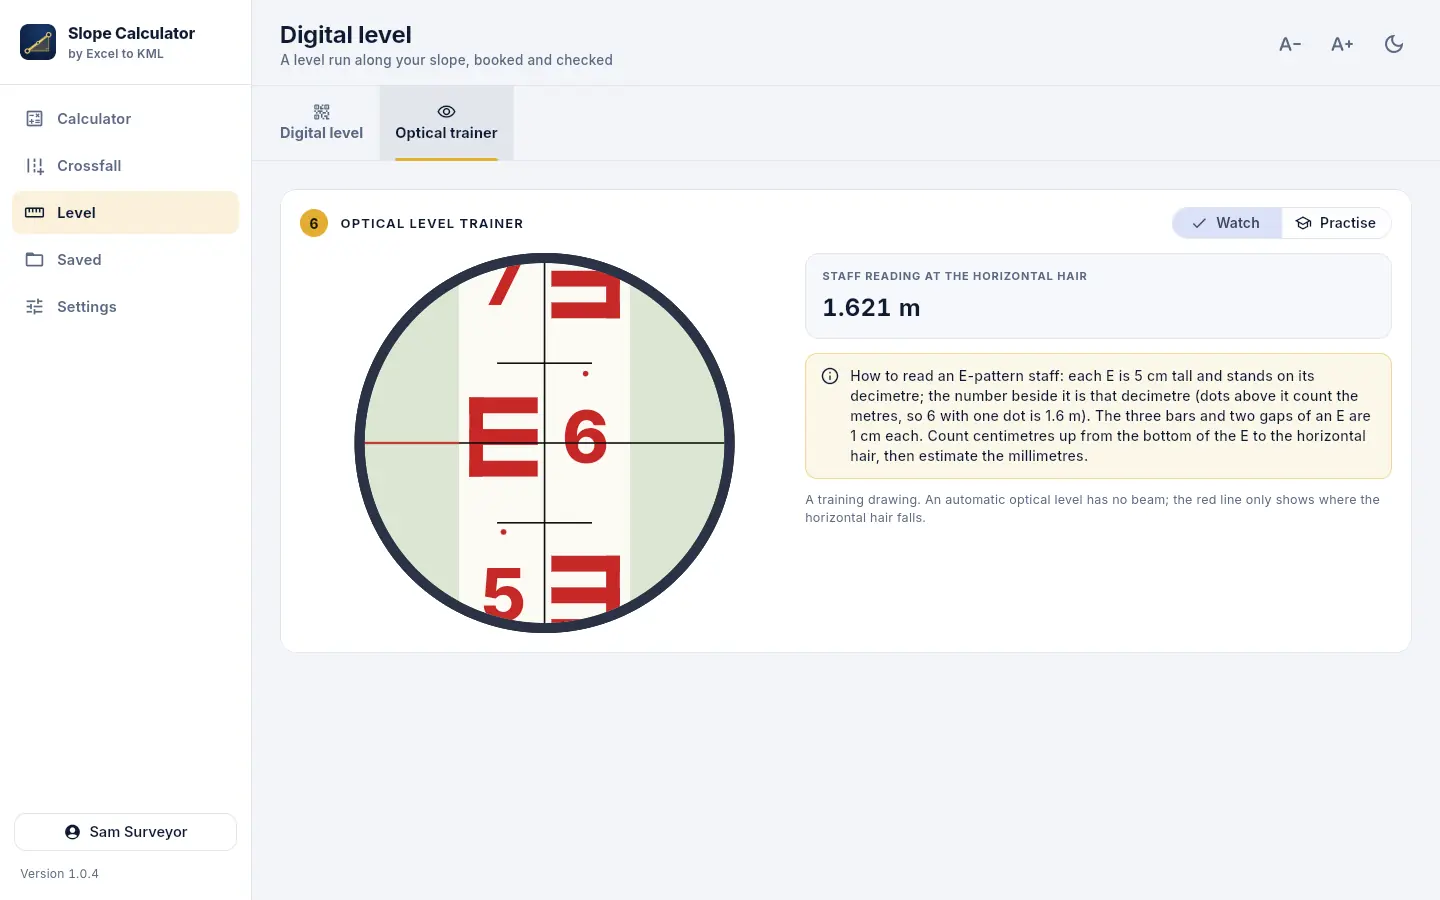
Level → Optical trainer shows the view through an optical level onto an E-pattern staff. Watch reads it for you; in Practise you type your reading and the app says whether it is within 2 mm. Each E is 5 cm tall and stands on its decimetre; the number beside it is that decimetre, with dots for the metres; count the centimetres up to the horizontal hair and estimate the millimetres.
9. Saved calculations and working offline
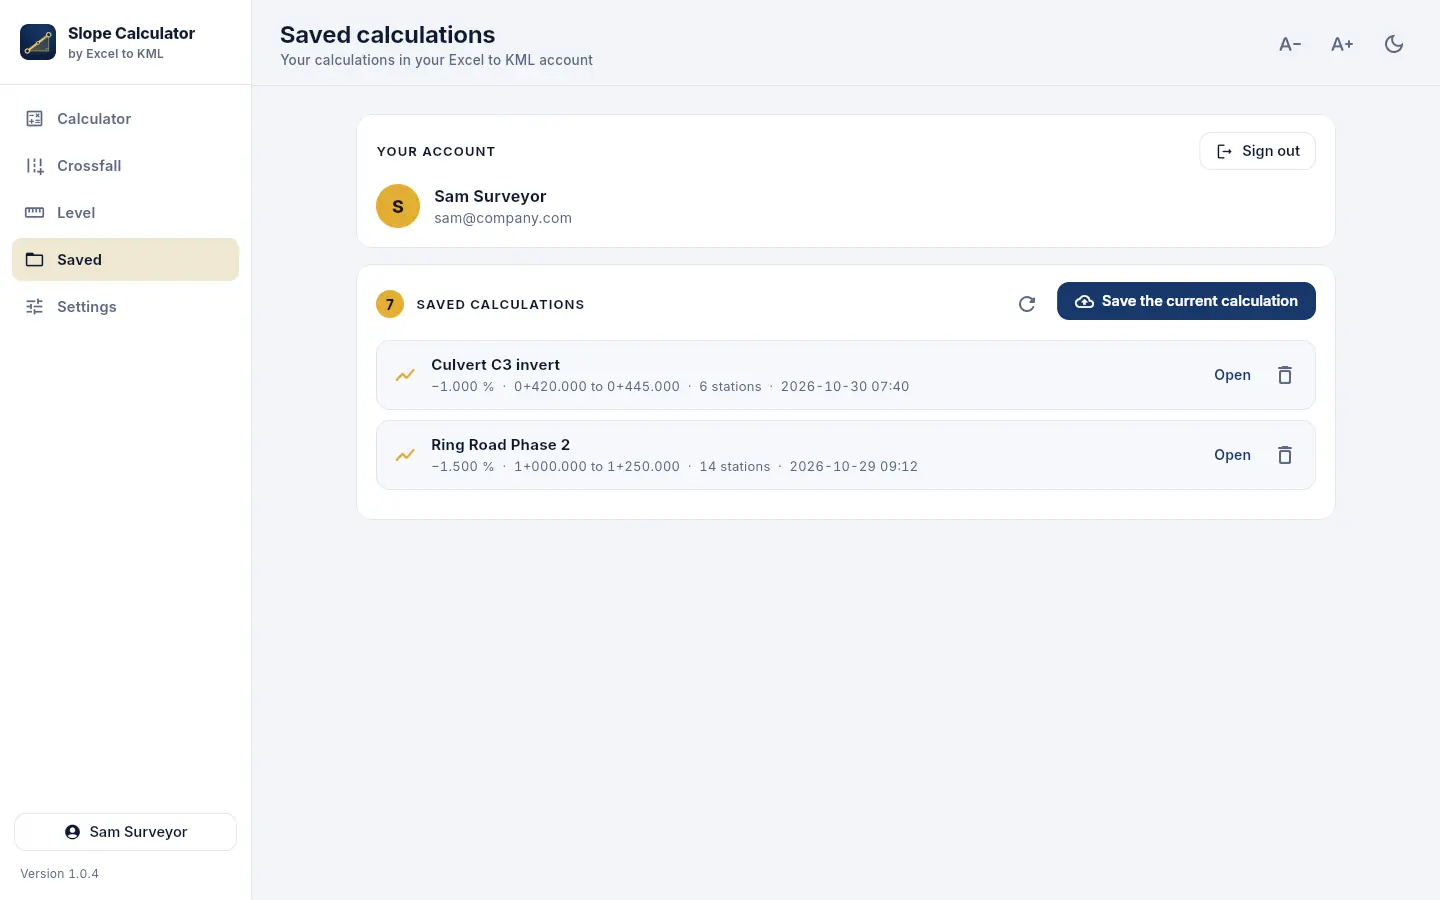
Saved keeps calculations in your account: Save the current calculation stores the inputs, the settings and the project plate under a name. Open brings one back into the calculator on any device, the Windows program, the web app or a phone; the bin deletes it everywhere.
Offline: a calculation saved or deleted without a connection waits on the device, marked Waiting to send, and is sent the next time the app reaches exceltokml.com (or press Send now). The list from the last time you were online is kept, so it shows offline too.
10. Settings
- Theme: follow the computer, or always light or dark (also the moon / sun button at the top).
- Text size: 85 % to 130 % (also A− / A+ at the top), on top of your computer's or phone's own text size (Windows: Settings → Accessibility → Text size).
- Stations: on round chainages, or counted from the start.
- Decimals and interval a new calculation starts with.
- Allowable misclosure: C in C√K mm for the level run (12 is common for ordinary levelling).
11. Worked examples
Check these by hand or against your own spreadsheet; each is also an automatic test of the app.
Example 1: slope and chainage levels
Y1 = 102.500 m, Y2 = 98.750 m, X1 = 1+000, X2 = 1+250, interval 20 m. ΔH = −3.750 m, ΔX = 250.000 m, M = −0.01500, slope −1.500 %, gradient 1 in 66.7, 14 stations.
| Chainage | Distance (m) | Level (m) | Change (m) |
|---|---|---|---|
| 1+000 | 0.000 | 102.500 | 0.000 |
| 1+020 | 20.000 | 102.200 | −0.300 |
| 1+040 | 40.000 | 101.900 | −0.600 |
| 1+060 | 60.000 | 101.600 | −0.900 |
| 1+080 | 80.000 | 101.300 | −1.200 |
| 1+100 | 100.000 | 101.000 | −1.500 |
| 1+120 | 120.000 | 100.700 | −1.800 |
| … | |||
| 1+240 | 240.000 | 98.900 | −3.600 |
| 1+250.000 | 250.000 | 98.750 | −3.750 |
Example 2: the Excel template's example
Y1 = 1.900 m, Y2 = 0.600 m, X1 = 0+000, X2 = 0+379.290, interval 20 m. ΔH = −1.300 m, slope −0.343 %, gradient 1 in 291.8, 20 stations; the level at 0+360 is 0.666 m and the last station is 0+379.290 at 0.600 m.
Example 3: crossfall
| Side | Crossfall | Offset | Direction | Level | Difference |
|---|---|---|---|---|---|
| Left | 2.0 % | 3.500 m | falls away | 9.9300 m | −0.0700 m |
| Right | 2.5 % | 3.500 m | falls away | 9.9125 m | −0.0875 m |
Centreline 10.000 m.
Example 4: a level book by Height of Instrument and Rise & Fall
Opening benchmark 100.000 m, closing on a known 99.700 m, 100 m of levelling.
| Line | BS | IS | FS | HI | Rise | Fall | RL | Adjusted RL | Remark |
|---|---|---|---|---|---|---|---|---|---|
| 1 | 1.585 | 101.585 | 100.000 | 100.0000 | BM | ||||
| 2 | 1.950 | 0.365 | 99.635 | 99.6325 | |||||
| 3 | 0.875 | 2.105 | 100.355 | 0.155 | 99.480 | 99.4775 | CP | ||
| 4 | 1.225 | 0.350 | 99.130 | 99.1250 | |||||
| 5 | 0.650 | 0.575 | 99.705 | 99.7000 |
- ΣBS − ΣFS = 2.460 − 2.755 = −0.295; last RL − first RL = −0.295 ✓
- ΣRise − ΣFall = 0.575 − 0.870 = −0.295 ✓
- Closing error +5.0 mm against an allowable 12√K = 3.8 mm: outside tolerance. Spread equally over the 2 setups for the adjusted levels.
12. The Excel template
For working in Excel without the app, the Slope Calculator Excel template does the same calculation in formulas. Type the levels, chainages and interval in the yellow cells; the results, every station on round chainages (up to 501) with its level, and the crossfall follow. It has the project plate too. It gives the same numbers as the app, as in the examples above.
13. Questions and fixes
- Windows says it protected my PC
- The program isn't code-signed yet. Choose More info, then Run anyway. Download it only from exceltokml.com; the product page shows its SHA-256.
- The email code didn't arrive
- Look in Spam or Junk, then press Send a new code. Codes are valid for a short time; the newest one counts.
- The app says it can't reach exceltokml.com
- You are offline or the connection is blocked. The calculator, reports and tools keep working once you have signed in; saving waits and is sent later.
- I want my calculations on another device
- Save them under Saved, then sign in with the same account on the other device and open them.
- The text is too small or too large
- Use A− / A+ at the top or Settings → Text size; the app also follows your computer's or phone's text size.
- How do I uninstall it?
- Windows Settings → Apps → Slope Calculator → Uninstall. Your account and saved calculations stay on exceltokml.com.
Questions or ideas? Write to us. Slope Calculator 1.0.2 · © 2026 Excel to KML.