From a survey spreadsheet to a file that opens in the right place in Google Earth, in four steps. The screenshots use the built-in sample job — click Try the sample in the app to follow along. The web app and the Windows app work the same way.
Any Excel or CSV sheet works if the first row names the columns. A typical total station or GNSS export looks like this:
STATION
CODE
EASTING
NORTHING
ELEVATION
REMARKS
TBM-01
TBM
513556.612
2787467.856
44.416
Brass plug
TR-01
TREE
513343.365
2787621.705
44.239
Date palm
The essentials are a point name and its position: Easting + Northing, or Latitude + Longitude.
Code sets the marker and colour; Elevation and Remarks show in the point's balloon.
Column order doesn't matter, and extra columns are kept.
Step 1
Load your points
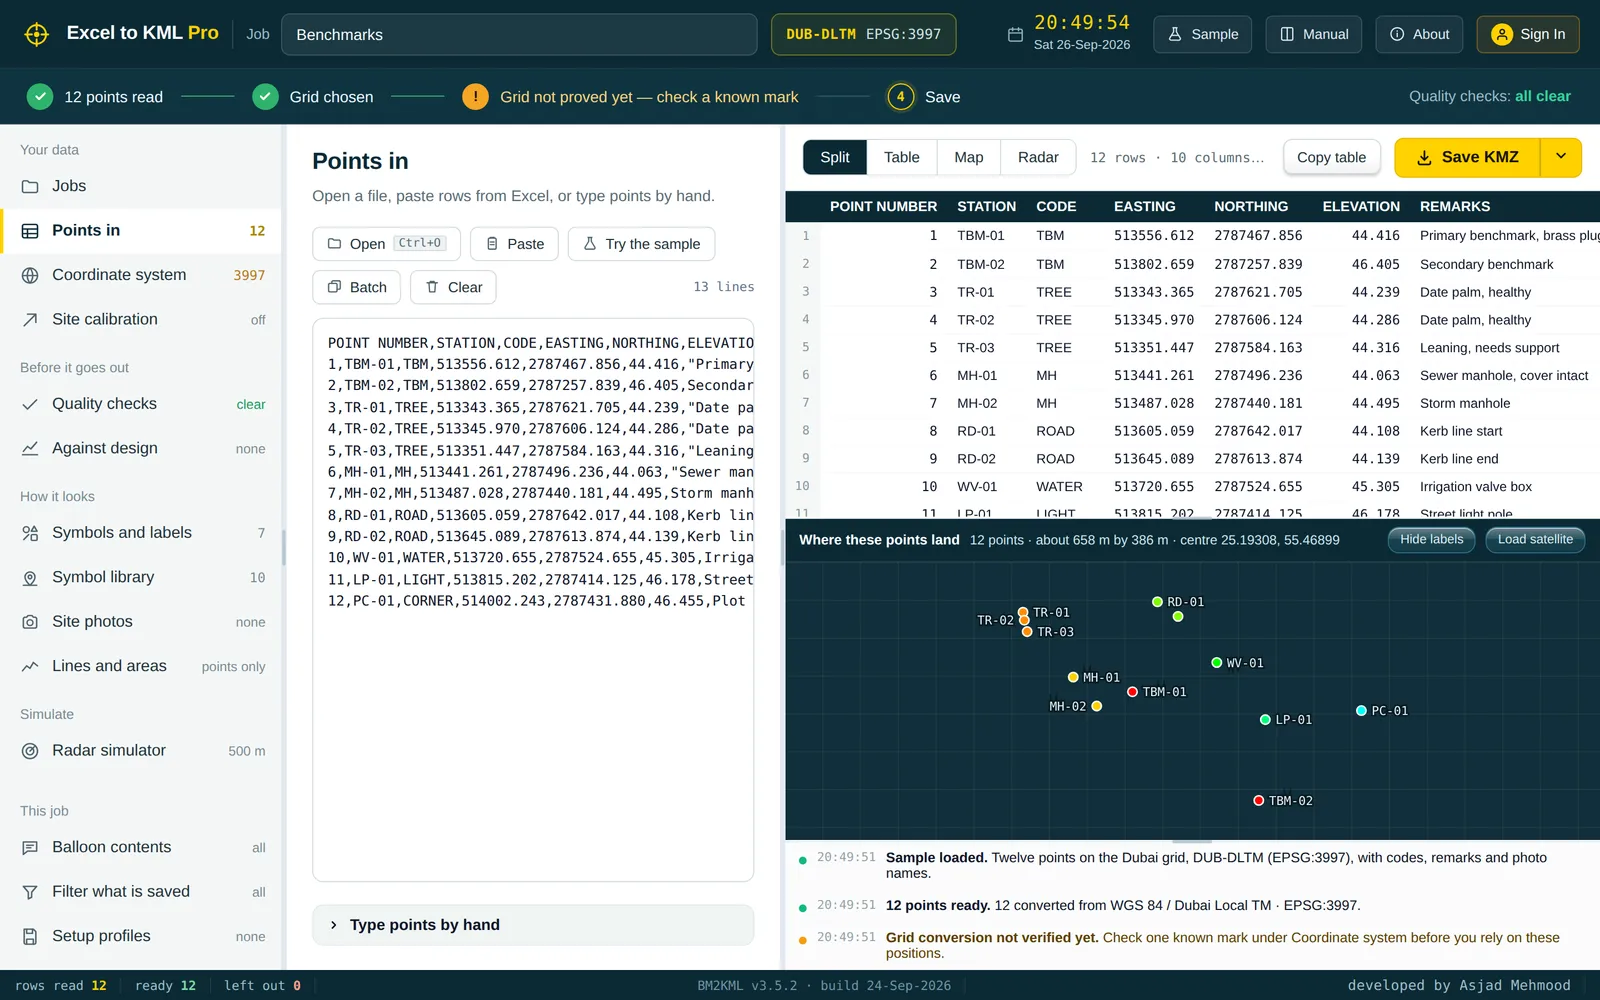
Open the app and choose Points in. Click Open (or press Ctrl+O) to load an Excel (.xlsx) or CSV file, click Paste to drop in rows copied from Excel, or open Type points by hand for a few points.
The first row should name your columns. The app recognises the usual survey headings — Station or Point, Code, Easting, Northing, Elevation, Remarks — and also Latitude and Longitude if your sheet already has them.
The table on the right shows every row it read, and the preview underneath shows where the points land. The status bar at the bottom counts rows read, points ready and rows left out.
New to the app? Click Try the sample to load a ready-made job and follow along.
Rows the app can't use are listed in the log with the reason, so nothing disappears silently.
Step 2
Choose your coordinate system
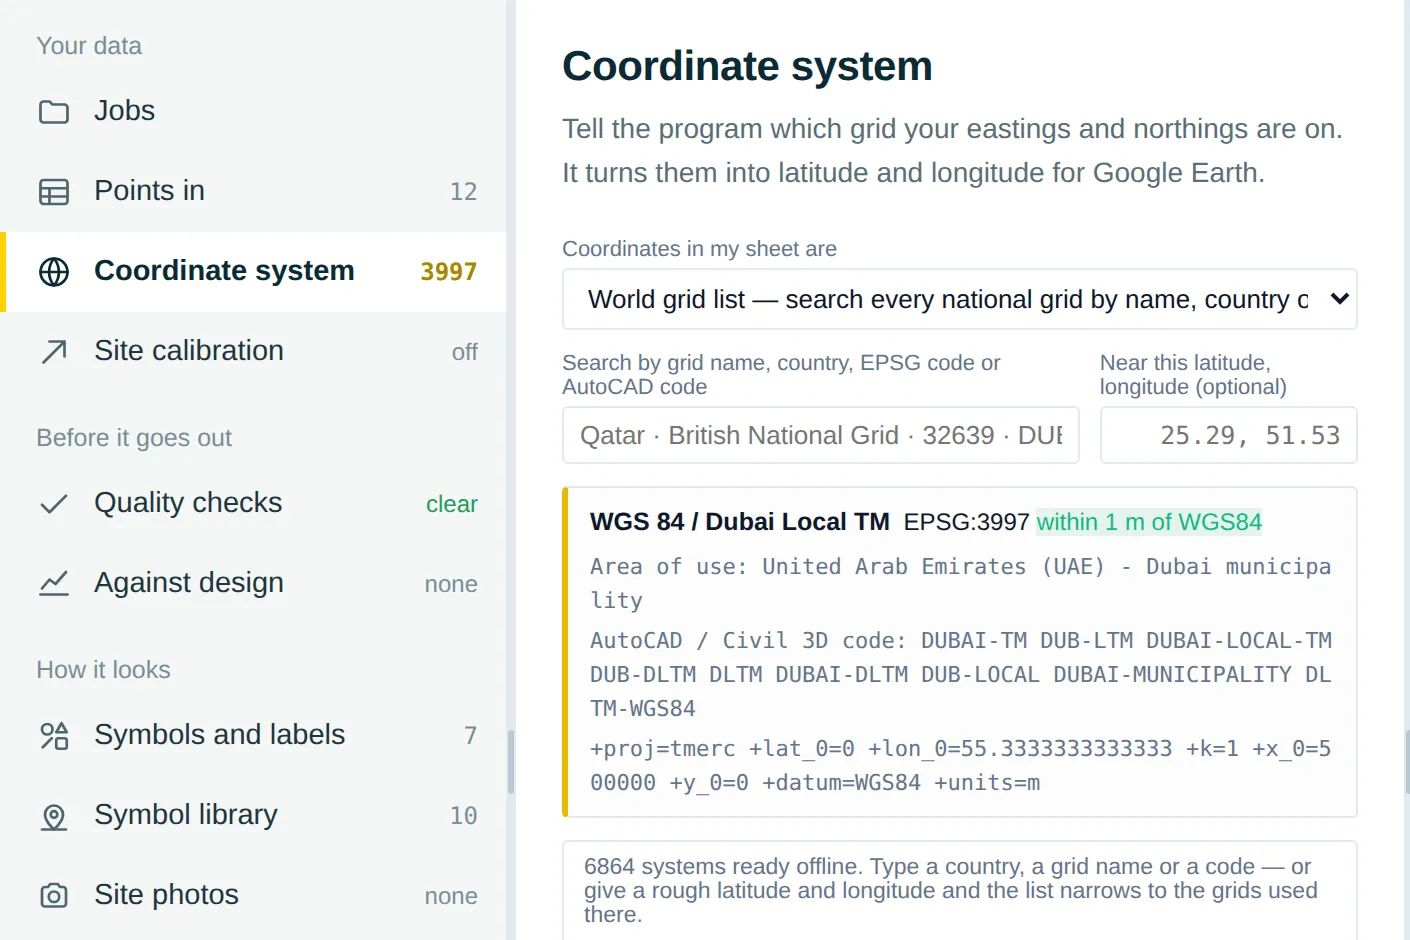
Go to Coordinate system and tell the app which grid your eastings and northings are on. Search by grid name, country, EPSG code or AutoCAD code — for example Dubai, Qatar, 32639 or British National Grid.
Not sure which one? Type a rough latitude and longitude for the site and the list narrows to the grids used there.
The panel shows the grid's area of use and how closely its datum ties to WGS 84, the datum Google Earth uses. Every system is stored inside the app, so nothing is looked up online.
Eastings and northings on the wrong grid are the most common cause of points landing in the wrong place — if they look shifted or in another country, check this step first.
Step 3
Prove the grid with a known mark
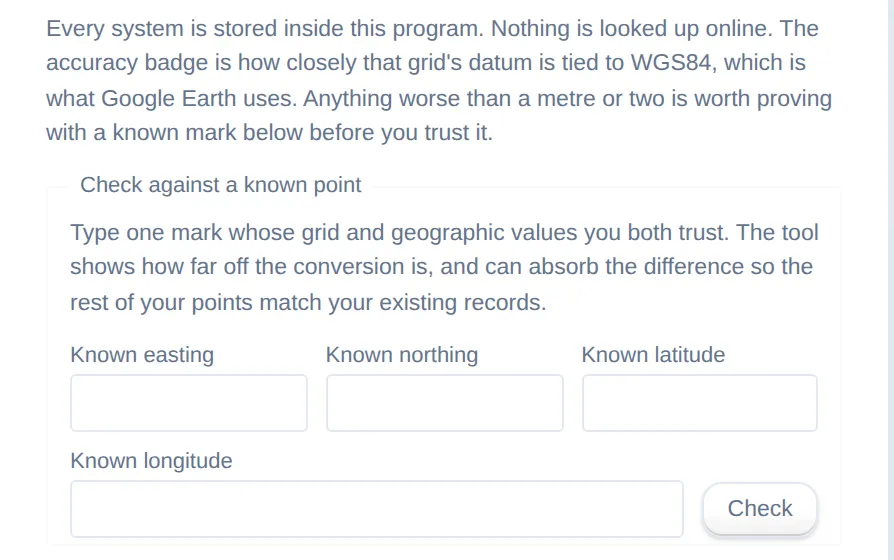
Under Coordinate system, use Check against a known point: type the grid and the latitude/longitude of one mark whose values you both trust — a benchmark or control point — and click Check.
The app shows how far off the conversion is. If it is within your tolerance, the step bar turns green. If not, the grid, zone or datum is probably wrong.
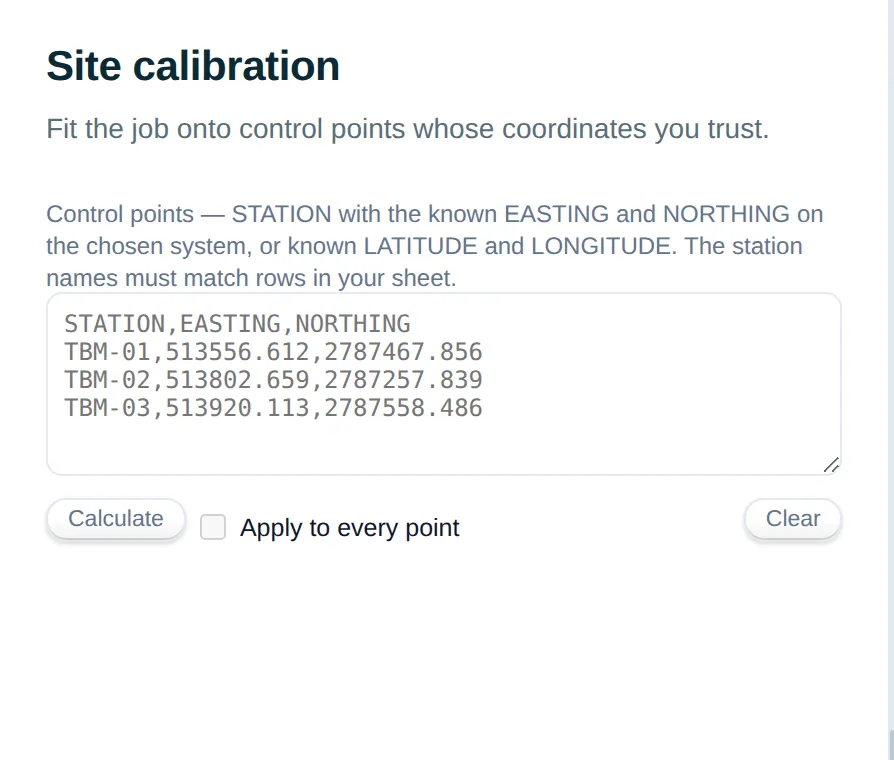
If your job is on a local site grid, use Site calibration instead to fit the job onto two or more control points.
Step 4
Save for Google Earth
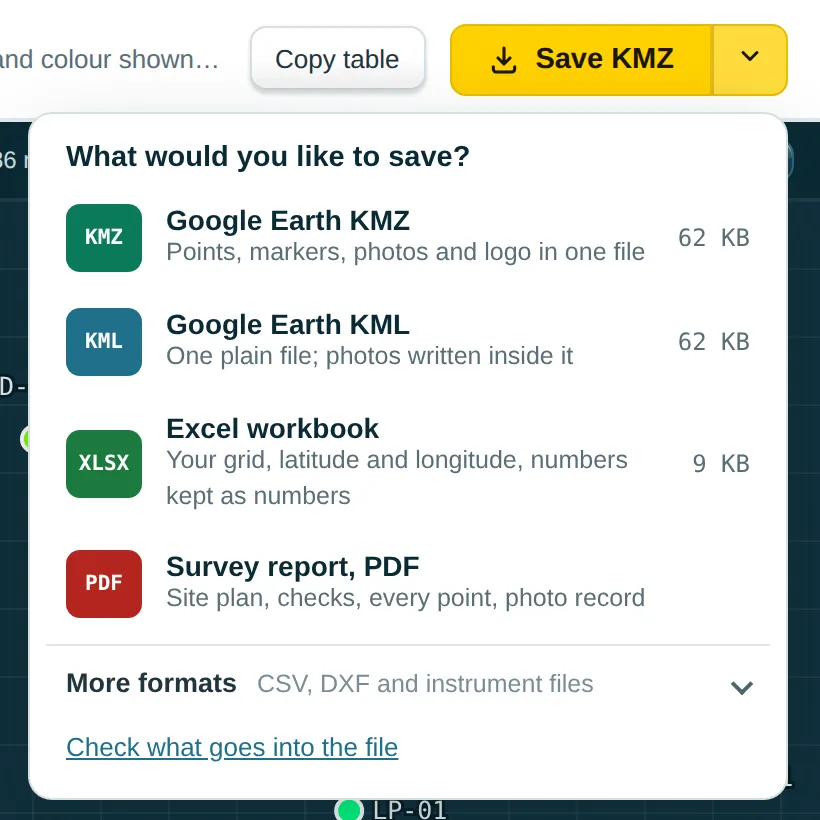
Click Save KMZ for the usual Google Earth file: points, coloured markers, photos and your logo in one file. Open the arrow next to it for the other formats.
Google Earth KML is a single plain file. Excel workbook gives you your grid and the converted latitude and longitude side by side. Survey report (PDF) adds a site plan, the checks, every point and a photo record. Under More formats you'll find CSV, DXF for AutoCAD and instrument files.
Double-click the saved KMZ or KML and it opens in Google Earth, in the right place, with each point's details in its balloon.
Check what goes into the file shows exactly which points, columns and photos will be saved before you save.
Go further
Optional tools in the left-hand menu, for when a plain set of points isn't enough.
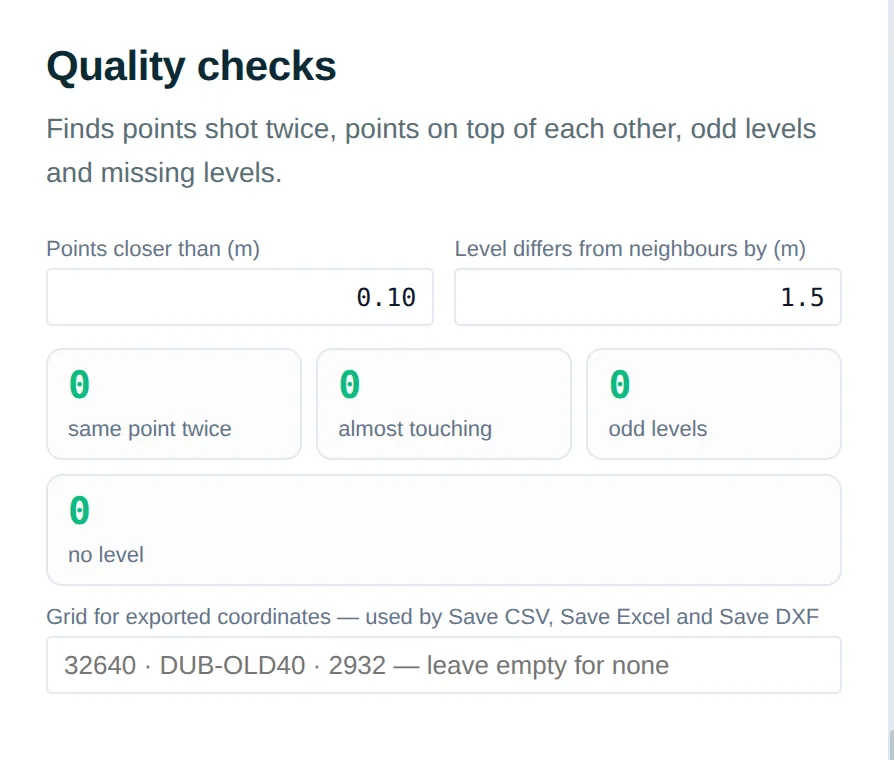
Quality checks
Finds points shot twice, points on top of each other, odd levels and missing levels before anything goes out. The step bar shows Quality checks: all clear when there is nothing to look at.
Against design loads the design sheet and shows how far each point is from where it should be.
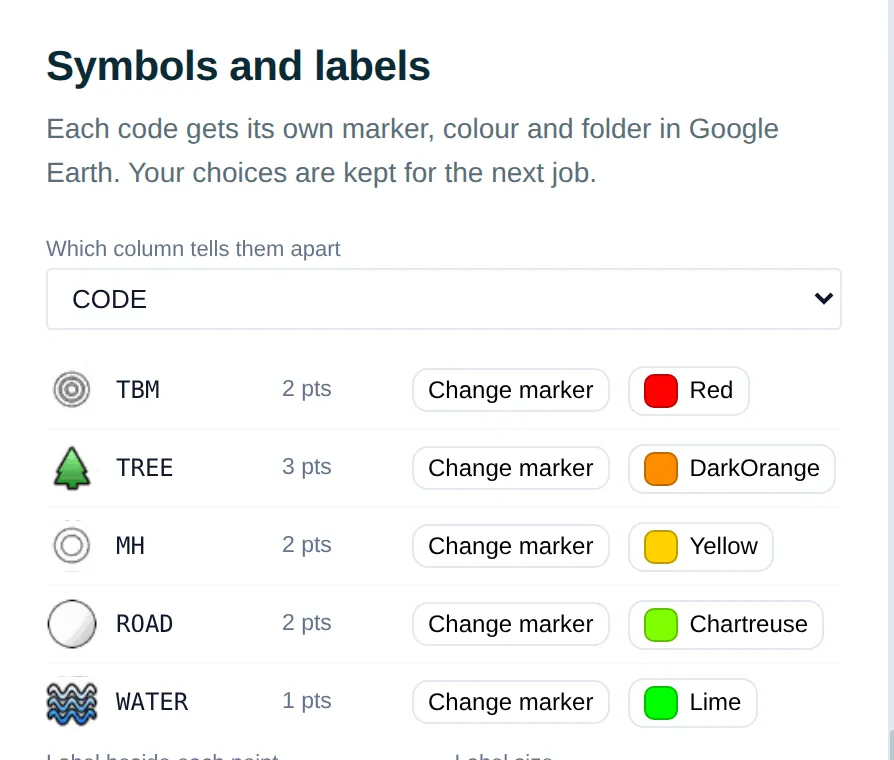
Symbols and labels
Each code gets its own marker, colour and folder in Google Earth — trees, manholes, benchmarks and so on. Your choices are kept for the next job, and Symbol library holds your codes so every job looks the same.
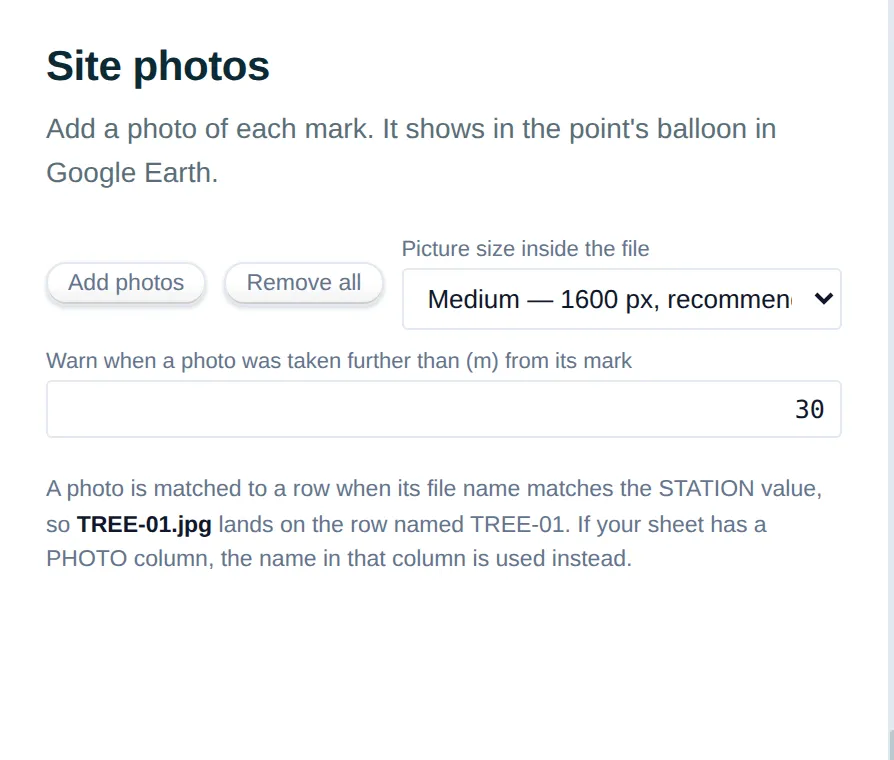
Site photos
Add a photo of each mark. A photo is matched to a point when its file name matches the point name (for example TBM-01.jpg), and it shows in the point's balloon in Google Earth. KMZ keeps the photos inside the file, so it works when you send it on.
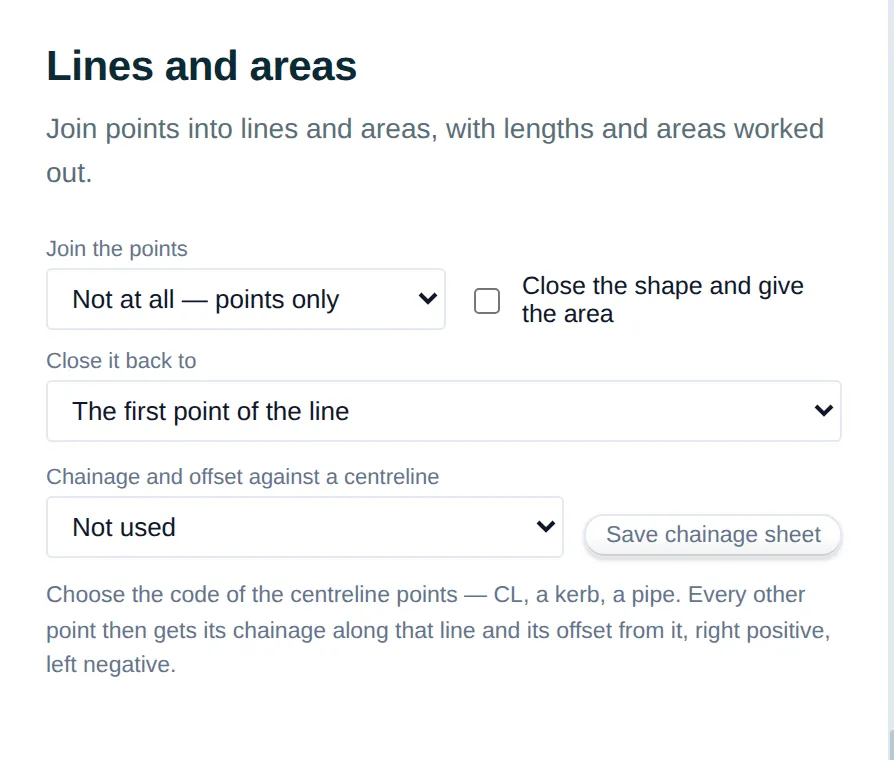
Lines and areas
Join points into lines and areas — plot boundaries, kerb lines, pipe runs — with lengths and areas worked out and shown in Google Earth.
Site calibration
For jobs on a local or arbitrary site grid: give two or more control points with trusted coordinates and the app fits the whole job onto them, showing the fit on each control point.
Preview on the map
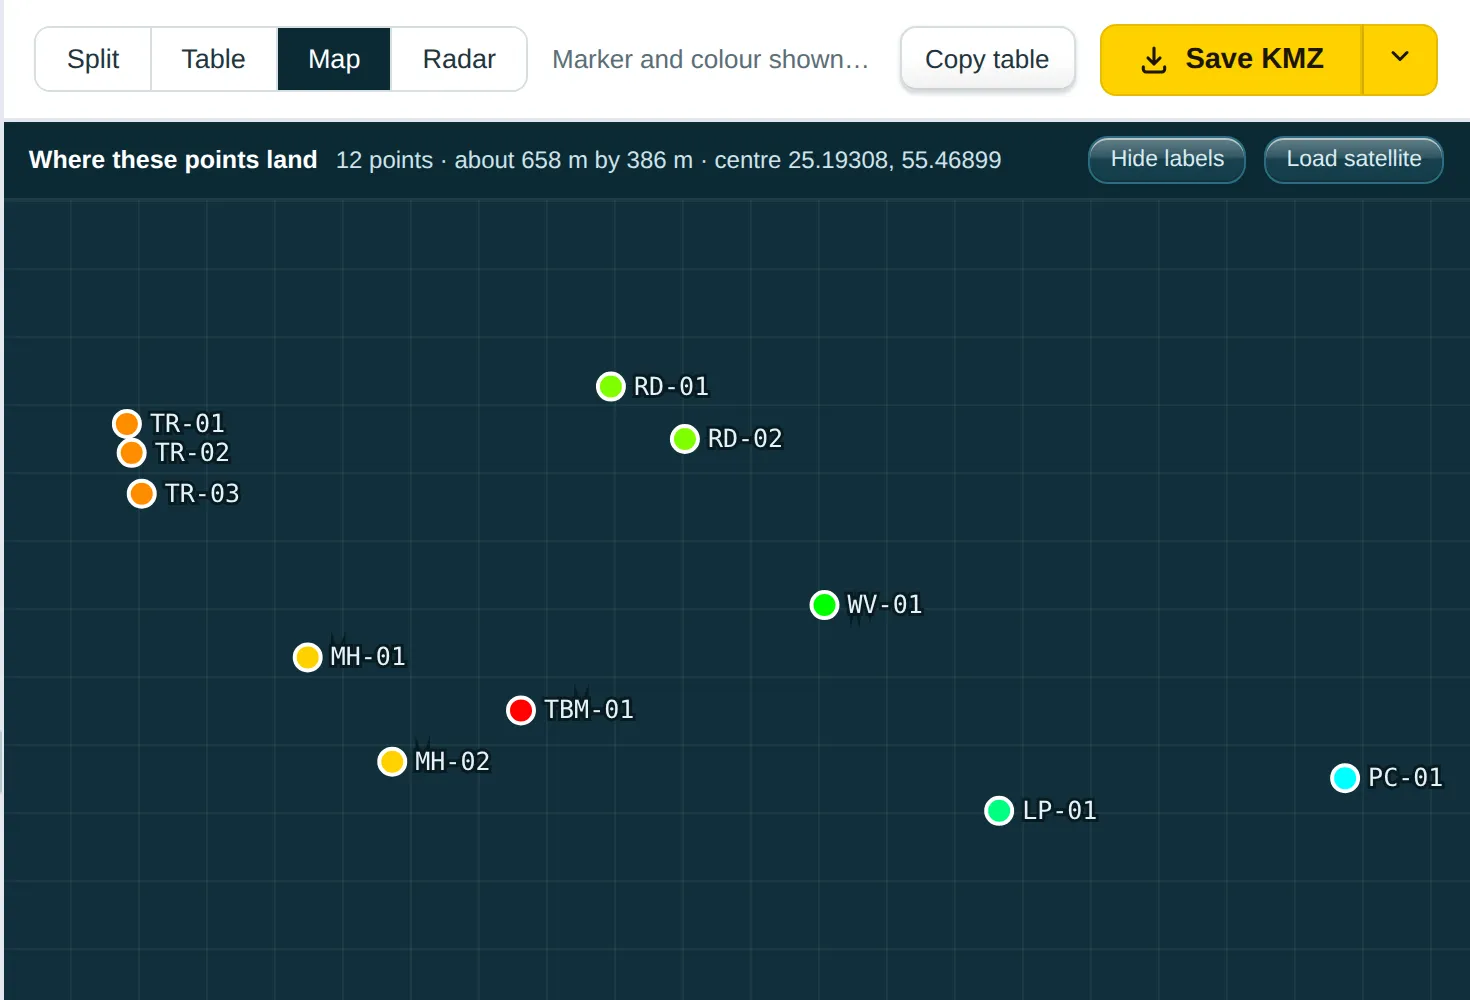
The Map tab shows every point with its marker and colour, and a legend of what the colours mean. Load satellite adds imagery underneath when you are online. Balloon contents chooses what each balloon shows, and Filter what is saved picks which points go into the file.
Ready to try it on your own sheet?
More help: guides for common jobs and grid pages for every coordinate system.